The July 2009
Case Shiller data was released today and July's median price for an existing home in Portland was down 13.9% from July 2008 at 150.06. (click on any chart to expand it to readable size) This is a significant improvement from the 16.3% decline in May.
The monthly change was up 1.1% from June. This is the third month in a row that the index has increased, which indicates that the $8k tax credit along with the usual summer seasonality might be helping to boost demand and therefore prices. The low interest rates aren't hurting either.
The median Portland home price is now down 19.5% from the peak in July 2007.
I previously predicted that prices would continue to decline through 2009, and I appear to be wrong. But I do believe that prices will stabilize or fall again if the tax credit expires in November given the high unemployment in Oregon and soft economy. Only then will we know if May was the bottom of the market, or if prices will decline again. I certainly don't believe we'll return to growth much higher than 0-4% anytime soon.
HOW PORTLAND PRICES COMPARE TO OTHER MARKETS
The above chart shows growth rates for Portland, Seattle, the San Francisco bay area (the other areas I consider as closest to Portland) as well as the 20-city composite index. Portland is doing a little better than Seattle, but note how the price declines in the Bay Area are really starting to slow.
The bottom has definitely passed there, and we might have hit bottom here as well. The negative price growth appears to have bottomed out in the Bay Area, but it's too early to tell if prices won't slide again once the tax credit expires and the next wave of foreclosures hit. Thanks to readers for catching that slip.
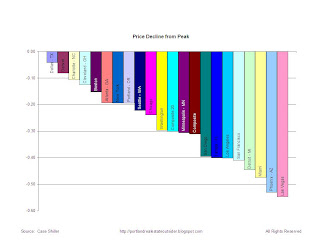
The above chart shows how Portland is faring compared to other cities. Our maximum price decline is still below average, but will we remain below average?
CURRENT PRICES VS HISTORIC AVERAGE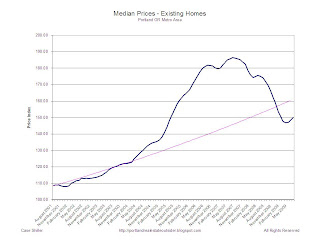
This chart shows the price index for the past 8 years. I also added a line in pink that represents an average of 5% growth starting in January 2001. You can see that the current price index is now below the 5% average growth line. An over-correction is to be expected, but we are also probably correcting to a more reasonable 3-4% long term growth rate, or about the rate of inflation.
FULL PORTLAND PRICE HISTORY
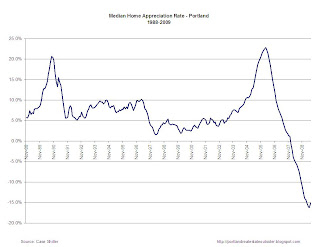
This chart shows the previous bubble in the early 90's, and also shows that Portland prices had never dropped over the past 20 years, until 2008.
Thanks for your patience during the gap in posting. The family and I were off on a 3 week vacation to Europe, and I'll share a few "fixer" photos of houses if Europe once we settle in again.
ABOUT CASE SHILLER:The S&P/Case-Shiller Home Price Indices measures the residential housing market, tracking changes in the value of the residential real estate market in 20 metropolitan regions across the United States. These indices use the repeat sales pricing technique to measure housing markets. First developed by Karl Case and Robert Shiller, this methodology collects data on single-family home re-sales, capturing re-sold sale prices to form sale pairs. This index family consists of 20 regional indices and two composite indices as aggregates of the regions.
Data presented in the Case Shiller spreadsheets are calculated monthly using a three-month moving average and published with a two month lag.