Tuesday, November 24, 2009

Portland existing home prices fall again in Septermber - Case Shiller


Wow, I miss one month and everything goes crazy. Back in July we were looking at 3 months of price increases. Prices peaked in August, but fell a bit again in September. I would expect prices to continue to increase through the end of the year, so we'll see where they go in October.

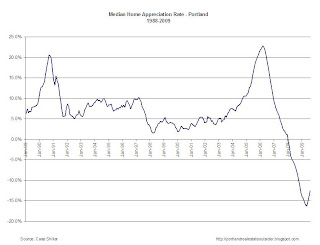
September's median price for an existing home in Portland was down 11.8% from September 2008 at 149.72. (click on any chart to expand it to readable size) This is a significant improvement from the 16.3% decline in May.

The monthly change was down 0.5% from August, reversing the increases we saw through the summer.

The median Portland home price is now down 19.7% from the peak in July 2007.

HOW PORTLAND PRICES COMPARE TO OTHER MARKETS


The above chart shows growth rates for Portland, Seattle, the San Francisco bay area (the other areas I consider as closest to Portland) as well as the 20-city composite index. Portland is now doing a little better better than Seattle, but note how the price declines in the Bay Area are really starting to slow. The negative price growth appears to have bottomed out in the Bay Area, but it's too early to tell if prices won't slide again once the tax credit expires and the next wave of foreclosures hit.
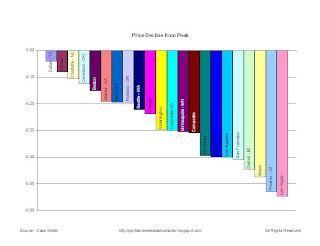
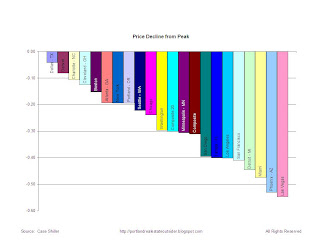
The above chart shows how Portland is faring compared to other cities. Our maximum price decline is still below average, and I'm starting to think we'll remain below average.

CURRENT PRICES VS HISTORIC AVERAGE
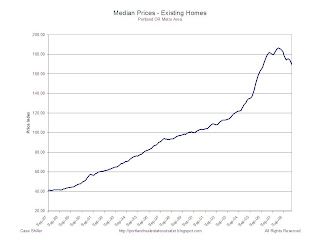
This chart shows the price index for the past 8 years. This month the pink line represents an average of 4% growth starting in January 2001. That puts us right about where we are today. A year ago we were well above 5% for the past 8 years. Why 4%? Why not.

FULL PORTLAND PRICE HISTORY

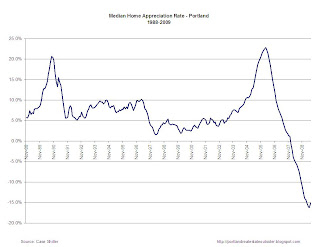
This chart shows the previous bubble in the early 90's, and also shows that Portland prices had never dropped over the past 20 years, until 2008.

Any thoughts on the latest stats? I'm thinking that most first time buyers have taken the plunge, and that prices will hover or drop another 5% over the winter, even with the extended tax credit.

ABOUT CASE SHILLER:

The S&P/Case-Shiller Home Price Indices measures the residential housing market, tracking changes in the value of the residential real estate market in 20 metropolitan regions across the United States. These indices use the repeat sales pricing technique to measure housing markets. First developed by Karl Case and Robert Shiller, this methodology collects data on single-family home re-sales, capturing re-sold sale prices to form sale pairs. This index family consists of 20 regional indices and two composite indices as aggregates of the regions.

Data presented in the Case Shiller spreadsheets are calculated monthly using a three-month moving average and published with a two month lag.

Add to Technorati Favorites

Friday, November 20, 2009

How not to build a real estate website

There's a house that's up for sale near me and I wanted to find out when they're holding an open house.

First I went to find the house on Trulia, and struck out.

So I found it on RMLS, then went to the Realtor's website for more details.

The realtor's site immediately asked me to register, without even offering up the same basic information I can get from RMLS.

There is enough competition and information out there that the LAST thing you want to do is make it harder for me, a potential buyer, to find information on your listings. I'll pass on this one.

Bad idea.

"For sellers we market Retail and Short Sale property in a fashion that does one thing....bring more attention to the home. Our online web representation and constant syndication of each listing combined with our unique web 2.0 style marketing is what gets homes sold."

Huh. Not found on Trulia, no photo when I finally did find it. And making me register? Web 2.0? Nope.

Add to Technorati Favorites

Thursday, November 12, 2009

First time home buyer credit extended and expanded


Late last week President Obama signed an extension of the $8,000 first time home buyer credit.

From the Redfin blog:

"...President Obama signed new legislation extending the deadline for the home buyer tax credit into 2010 and expanding it to include current home owners who are looking to buy a primary residence.

The Basic Requirements

You qualify for the tax credit if the:

  • Home you’re buying will be your primary residence
  • Purchase price isn’t more than $800,000

This credit is not a loan; it’s yours, but keep in mind you have to live in your new home for three years. If you sell the home in less than three years, you’ll have to pay back the money.

What’s Changed?

With the new legislation, buyers have more time to find a home and more buyers are eligible for the tax credit:

  • New deadline: To qualify, you need to be in contract with a seller by April 30th & close on the home by June 30th (The previous deadline was November 30, 2009).
  • Not just for first-time buyers anymore: Home buyers who’ve owned and occupied a home for at least five consecutive years during the past eight years are eligible for a credit up to $6,500.
  • Increased income limits: Individuals making less than $125,000 and couples making less than $225,000 are eligible (The limits used to be $75K & $150K).

First-time buyers are eligible for a credit up to $8,000 on homes purchased between January 1, 2009 and June 30, 2010. Qualified homeowners can a credit up to $6,500 on homes purchased between November 7, 2009 and June 30, 2010."

This should help keep sales moving through the winter. But the question is how long will they keep propping up the market before letting it return to "normal".

Add to Technorati Favorites

Monday, November 9, 2009

Historic Autzen up for Sale - Down to $2.25M


We've been admiring this house ever since we moved to NE Portland and I'e wondered what the story was behind this house, and I recently learned it's the historic Autzen estate. I was surprised to run past it the other day and see it for sale. Apparently it's been on sale for a while.

Since 2003.


The house is stunning. Over 10,000 ft, 6 bedrooms, 5 full bathrooms and 3 half bathrooms. And for you fellow car nuts out there, a 3 car garage (that's about the same size as our house). Of course, I'd hate to see the heating bill.

The Autzen's spared no expense on the house when it was built. There is an alcove for the grand piano, a full ballroom (that is now being used as a game room) and a lot of wood.

The current owners bought it for $895k, spent $500k restoring it, and put it on the market in 2003 for $2.95M. The somehow managed to miss the entire real estate boom, and the house still sits on the market at $2.25M.

Wednesday, September 30, 2009

Think your property taxes are going down this year along with your house value?

Think again.

The Oregonian has a good story that highlights why most people will see a property tax increase this year.

"As you watched your home value plummet in this recession, at least you could look forward to a property tax break, right?

Wrong.

The tax bills that county assessors across the state will be sending out next month will likely show drops in the market value of most homes, but that won't translate into lower taxes."

Add to Technorati Favorites

Tuesday, September 29, 2009

Portland existing home prices up again in July - Case Shiller


The July 2009 Case Shiller data was released today and July's median price for an existing home in Portland was down 13.9% from July 2008 at 150.06. (click on any chart to expand it to readable size) This is a significant improvement from the 16.3% decline in May.

The monthly change was up 1.1% from June. This is the third month in a row that the index has increased, which indicates that the $8k tax credit along with the usual summer seasonality might be helping to boost demand and therefore prices. The low interest rates aren't hurting either.

The median Portland home price is now down 19.5% from the peak in July 2007.

I previously predicted that prices would continue to decline through 2009, and I appear to be wrong. But I do believe that prices will stabilize or fall again if the tax credit expires in November given the high unemployment in Oregon and soft economy. Only then will we know if May was the bottom of the market, or if prices will decline again. I certainly don't believe we'll return to growth much higher than 0-4% anytime soon.

HOW PORTLAND PRICES COMPARE TO OTHER MARKETS

The above chart shows growth rates for Portland, Seattle, the San Francisco bay area (the other areas I consider as closest to Portland) as well as the 20-city composite index. Portland is doing a little better than Seattle, but note how the price declines in the Bay Area are really starting to slow. The bottom has definitely passed there, and we might have hit bottom here as well. The negative price growth appears to have bottomed out in the Bay Area, but it's too early to tell if prices won't slide again once the tax credit expires and the next wave of foreclosures hit. Thanks to readers for catching that slip.
The above chart shows how Portland is faring compared to other cities. Our maximum price decline is still below average, but will we remain below average?

CURRENT PRICES VS HISTORIC AVERAGE

This chart shows the price index for the past 8 years. I also added a line in pink that represents an average of 5% growth starting in January 2001. You can see that the current price index is now below the 5% average growth line. An over-correction is to be expected, but we are also probably correcting to a more reasonable 3-4% long term growth rate, or about the rate of inflation.

FULL PORTLAND PRICE HISTORY


This chart shows the previous bubble in the early 90's, and also shows that Portland prices had never dropped over the past 20 years, until 2008.

Thanks for your patience during the gap in posting. The family and I were off on a 3 week vacation to Europe, and I'll share a few "fixer" photos of houses if Europe once we settle in again.

ABOUT CASE SHILLER:

The S&P/Case-Shiller Home Price Indices measures the residential housing market, tracking changes in the value of the residential real estate market in 20 metropolitan regions across the United States. These indices use the repeat sales pricing technique to measure housing markets. First developed by Karl Case and Robert Shiller, this methodology collects data on single-family home re-sales, capturing re-sold sale prices to form sale pairs. This index family consists of 20 regional indices and two composite indices as aggregates of the regions.

Data presented in the Case Shiller spreadsheets are calculated monthly using a three-month moving average and published with a two month lag.


Add to Technorati Favorites

Monday, August 31, 2009

The effect of interest rates on prices

In an earlier post a reader commented on the effect of rising interest rates on prices, and when the bottom would be reached.

"I am curious about increasing interest rates and how they will affect when the bottom is called. How cheap does the house have to be to offset increasing interest rates? "
So I ran a simple scenario.

A $200k loan at 5% interest over 30 years gives a monthly payment of $1074.

If interest rates increase by 1% (a 20% increase) then the same $1074 payment only gets you a $179,134 loan. That's a 10.4% decrease.

So if the bottom of the market is driven by buyers who are buying the max they can afford, and assuming lenders actually go back to the days of the 28/36 rule (PITI no more than 28% of your monthly gross income, total dept no more than 36%) then if interest rates rise 1% it will theoretically drive down prices approximately 10%.

The reader had another comment:

"I remember Portland housing costing as low as $10,000 in the Alberta Arts district. (1990). A nice house in Hawthorne could be had for $60,000 around that time. Of course interest rates were around 21% and no one could afford the payments back then."
I'm pretty sure that 21% interest was back in the early 80's but that's not the point. If interest rates did rise that high again, then that $200k loan suddenly plumments to $61k. That's a scenario nobody wants, not buyers or sellers.

Add to Technorati Favorites

Wednesday, August 26, 2009

Portland existing home prices up slightly in June - Case Shiller

The latest Case Shiller data was released yesterday, and prices in Portland have ticked up 1% from May to June.

Year over year we're still down 15.2% and we're down 20.4% from the peak.

It looks like the $8k credit might be having an effect, but it's still a bit premature to signal the bottom.

Tune in later for full charts / analysis, but the raw data is available above for the data hounds out there.

Add to Technorati Favorites

Think twice before taking that sink!


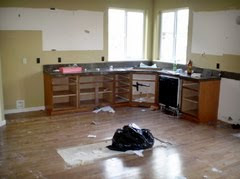
A local Damascas man was arrested after stripping his house after losing it to foreclosure (Oregonian). The photo above shows what it looked like before he stripped it. See below for the after shot.

DAMASCUS -- After stripping his foreclosed home of everything from the air conditioning system to the kitchen sink, Grigoriy Bogoslavets was convicted of a crime that is often witnessed but rarely reported.

The 33-year-old electrician pleaded no contest last month to aggravated theft after stealing more than $50,000 of property attached to his former Damascus home, one of the few such cases in Oregon or across the country to result in prosecution. He will be sentenced Sept. 22.

This guy was thorough, he even took the outlets! Seriously, they cost $1.5 at home depot, I'm thinking their street value is pretty much zip. This guy was serious. Unfortunately it's likely to cost him four years in jail.

"Banks, which usually can recoup losses from insurance claims, rarely take the time and effort to report theft of home fixtures. But law enforcement officials say nearby residents, eager to preserve their own home values, are starting to turn in their former neighbors.

That's what happened in the Bogoslavets case. Neighbors tipped off police when they saw Bogoslavets return to his former home with a van after vacating the premises. Investigators discovered Bogoslavets had taken nearly everything he could remove, including the kitchen island, fireplace, bathtubs, the doorbell and electrical outlets."

The morale? If you're losing your house to foreclosure think twice about gutting it, it's just not worth it.


Add to Technorati Favorites

$50k free to buy a foreclosure?


From today's Oregonian:

"If you meet the income guidelines, the government might have a house deal for you. You may be eligible for a $50,000 interest-free loan to help move into a foreclosed home. The program, adopted by Congress last year, is aimed at preventing foreclosed houses from standing empty, bringing down neighborhood livability and property values."


I honestly don't see much downside to this program.

For the buyers you get free money, which you only have to pay back when you sell.

They are limiting it to Bank Owned properties, which limits the buyer's risk (we bought a bank owned home last year, I'll talk more about it soon) and is what I feel the best way to get a good deal on a foreclosure.

This program isn't keeping people in homes they can't afford, it's just helping keep houses from sitting vacant and gives banks an incentive to sell them at realistic prices.

Unfortunately there are only 160 bank owned houses in Multnomah county at the moment, so the pool of available properties is limited. But they are out there.

Add to Technorati Favorites

Thursday, August 13, 2009

Oregon breaks top 10... for foreclosures


Oregon now has the 10th highest rate of foreclosures in the nation according to RealtyTrac and CNN, putting us in good company with other states like California, Florida and Nevada.

In July there were 1 foreclosure in Oregon for every 446 households, and a total of 3605 foreclosure events.

Hitting closer to home, one house on our block was sold at auction this past week and the flippers are hard at work fixing it up for resale.

Add to Technorati Favorites

Thursday, July 30, 2009

Portland area foreclosures skyrocket in H1 2009

(I believe the second and third headers are switched on the graphic above. The second column is the % of houses in foreclosure, the third column is the rate or 1/xx houses)

In what should be no surprise to anybody here, Portland foreclosures are up 112% in H1 2009 according to the latest Realty Trac data which was released yesterday:

Portland now ranks 60th out of 203 metro areas with 1.31% or 1 out of 76 of all households in some form of foreclosure, a bit higher than the national average of 1.19%.

Las Vegas NV leads the nation with 1 out of every 13 homes in some form of foreclosure.
Seattle is faring better than Portland, ranking 76th with .94% of households in foreclosure.
Salem OR is doing slightly better than Portland, ranking 64th with 1.18% in foreclosure, while the Eugene area is doing much better with only .80% in foreclosure and a ranking of 94th.

While California still holds a number of top spots in the rankings, the rate of foreclosure has declined in most areas. I predict that Portland will climb in the rankings before we fall since we're late to this party and facing higher unemployment than most areas.

Add to Technorati Favorites

Portland neighborhood maps now available

I realized after talking about neighborhoods yesterday that I never added a link to the local Portland neighborhood maps.

When we were first looking for a place to live a few years ago these maps were very handy to help guide where we wanted to live, as these maps are dictated by school disctricts which is what most people with kids are concerned about.

Also, even though Realtors love terms like "Alberta Arts" that isn't a neighborhood, nor is "Hawthorne".

The link will live in the tools section on the right, and feel free to suggest other tools that you find useful.

Add to Technorati Favorites

Wednesday, July 29, 2009

How is your neighborhood doing?


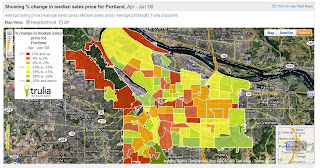
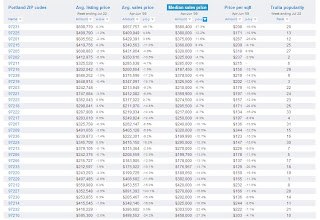
Trulia is a wealth of information, and one of my favorite features is their pricing heat map.

You can see recent price activity for individual neighborhoods to see which 'hoods are still hot, and which are fading fast.

I've included the data by zipcode here, as I can't fit it by neighborhood, but if you go here you will see it.

Just be careful, the amount of data in these analysis is small, so the margin of error is high and the trends can change quickly.

Any comments on why certain areas are holding their prices while others aren't?

Add to Technorati Favorites

Tuesday, July 28, 2009

Price recovery, or dead cat bounce? - May Case Shiller


The May 2009 Case Shiller data was released yesterday and May's median price for an existing home in Portland was down 16.3% from May 2008. (click on any chart to expand it to readable size)

The monthly change was up 0.1% from April. Before everybody gets too giddy about the recovery just remember that this is likely just seasonality as prices also rose slightly in May 2008 before continuing to fall. If we see price increases for 3 months in a row then we can start talking about a recovery.

The median Portland home price is now down 21.2% from the peak in July 2007,

At this point if I would predict prices will continue to decline through 2009 and well into 2010.

A reader asked me recently why I focus so much on the price changes, rather than the actual changes. Because by focusing on the change, and the rate of change in prices you get an early indication into future prices. So while prices in other markets may still be declining, the change in price is also declining signaling a bottom to the declines.

HOW PORTLAND PRICES COMPARE TO OTHER MARKETS

The above chart shows growth rates for Portland, Seattle, the San Francisco bay area (the other areas I consider as closest to Portland) as well as the 20-city composite index. Portland and Seattle are still tracking each other very closely. Lase month Seattle saw a slight uptick in prices while Portland prices continued to decline. This month the trend reversed with Seattle prices continuing to slide and Portland prices rising slightly.

While the price declines for the overall market appears to have hit bottom, Portland and Seattle have slowed but not reversed. The price declines in the SF Bay Area also seem to have bottomed out and are now slowing. Prices have ticked up for the past few months but it remains to be seen if they will continue or slide again this winter.


The above chart is a recent addition. It shows how Portland is faring compared to other cities. Our maximum price decline is still below average, but as we all know Portland was late to this party, a party most homeowners didn't want an invitation to. As the average improves I predict Portland will be worse than average shortly

CURRENT PRICES VS HISTORIC AVERAGE

This chart shows the price index for the past 8 years. I also added a line in pink that represents an average of 5% growth starting in January 2001. You can see that the current price index is now below the 5% average growth line. An over-correction is to be expected, but we are also probably correcting to a more reasonable 3-4% long term growth rate, or about the rate of inflation. But it's likely that we'll over correct before getting there.

FULL PORTLAND PRICE HISTORY


This chart shows the previous bubble in the early 90's, and also shows that Portland prices had never dropped over the past 20 years, until 2008. But as they say, past performance is no guarantee of future performance!

This chart also shows the full available price history for Portland. I'm working to convert it to a log chart which will show the changes better.

ABOUT CASE SHILLER:

The S&P/Case-Shiller Home Price Indices measures the residential housing market, tracking changes in the value of the residential real estate market in 20 metropolitan regions across the United States. These indices use the repeat sales pricing technique to measure housing markets. First developed by Karl Case and Robert Shiller, this methodology collects data on single-family home re-sales, capturing re-sold sale prices to form sale pairs. This index family consists of 20 regional indices and two composite indices as aggregates of the regions.

Data presented in the Case Shiller spreadsheets are calculated monthly using a three-month moving average and published with a two month lag.

Add to Technorati Favorites

Friday, July 24, 2009

Freddie Mac - Youtube sensation?


This headline caught my eye as it appealed to both the marketer in me and my interest in real estate:

"Freddie Mac turns to YouTube to help troubled homeowners"

Mortgage giant Freddie Mac is using YouTube.com to educate homeowners at risk of foreclosure on how they can help reduce the stress and time it takes to get a mortgage modification under President Obama's Making Home Affordable program or Freddie Mac's other workout programs.

Freddie Mac posted a new video on the site that tells borrowers what financial documents they need to have available before calling a mortgage servicer. The documents will enable the mortgage servicer to determine the homeowners' eligibility for a workout and process the application, Freddie Mac representatives note.

The two-minute video, available in English and Spanish, can be seen at www.youtube.com/FreddieMacWeb.

Huh, maybe they've hired some new talent.


Add to Technorati Favorites

Thursday, July 23, 2009

Commercial real estate following path of residential real estate - off cliff


Today's Oregonian featured a story about another local developer who is facing foreclosures and behind on back taxes:

John Beardsley, known for renovating historic downtown buildings, is Portland's first major commercial developer to see his properties move toward foreclosure amid growing problems nationwide in commercial real estate.

Since May 1, lenders have filed default notices -- the first step in a foreclosure -- on 10 properties owned by Beardsley's companies. The defaults cover loans and sales contracts originally signed for $58 million and taken out during the real estate bubble between 2003 and 2007, according to Multnomah County property and court records

Beardsley also owes the county $354,000 in back taxes, according to county records.

As opposed to the denials about the state of the residential market, John seems to be very honest about how bad it is, and how bad it's going to get:

"The bottom fell out of the market," Beardsley said. "I'm a reality of it. Tom Moyer's a reality of it. It's a very sobering time. ... This is significantly worse than the 1980s."

That reality, Beardsley said, reflects the economy: Struggling employers have laid off workers, reduced their office space, asked for cheaper rent or closed altogether. The result: Beardsley's average rents have dropped and office vacancies have jumped to 25 percent, more than double the normal rate.

"It's a very difficult market in commercial real estate," said Al Kennedy, Beardsley's lawyer and one of the city's go-to attorneys for financially troubled companies. "It's just beginning to surface."

The Portland Business Journal also recently reported on the state of the commercial market nationally:

Commercial real estate values around the country have dropped 35 percent from their peak in October 2007, according to Moody’s REAL Commercial Property Price Indices.

The decline appears to be accelerating as the index dropped more than 15 percent during April and May. Transactional volume also fell along with value, which is showing signs of effects from distressed sales.

“May marked a new low for both counts,” the report said.

Along the lines of kicking a sector when it’s down, a rise in interest rates caused several deals to unravel, hitting apartment sales the hardest.

To calculate the index, Moody’s used 52 repeat sales, which had a dollar value of $400 million in April 2002.

It sounds like the commercial troubles are only going to get worse, while the residential market problems are starting to slow down nationally.


Add to Technorati Favorites

Friday, July 17, 2009

Portland Prices Down 13.5% in June - RMLS

June sales data was released yesterday according to the Portland Business Journal, and the average sales price for June was down 13.5% from June 2008, about the same as last months drop.

Closed sales were only down 5% from June 2008, which sounds like the rebate might be having and effect as well as reducing inventory.

More analysis later, TGIF! Enjoy the weekend folks!

Add to Technorati Favorites

Wednesday, July 15, 2009

Prices slashed at the John Ross condos


Condos still aren't moving, so prices are continuing to fall. This price cut is pretty serious. From the Portland Business Journal today:

"Gerding Edlen Development Co. has added the John Ross condominiums at
South Waterfront to list of projects with slashed prices.

The company cut prices by approximately one-third in a bid to find buyers
for 110 unsold units in 18 months....

A sample of units available at John Ross include a 12th floor studio now
available for $199,999, down $100,000. The new price translates to $311 per
square foot.

A 30th floor penthouse unit with three bedrooms and three and a half
bathrooms now is available for $1.5 million, down nearly $1 million. The new
price is equal to $434 per square foot.

Realty Trust notified John Ross homeowners of the decision to cut prices on
July 10."


While those current homeowners must have known that their condos were worth less than they paid earlier, they now have a nice figure to quantify their loss. 33%. Ouch.

I still wouldn't touch a condo in Portland for the next few years, if not ever.

Add to Technorati Favorites